Sample Astronomy Projects
Unleash your students’ “inner scientist!” Learn how easy it is to capture an exciting star spectrum using just your current DSLR, video camera, or FITS camera.
Below, Senior Sky & Telescope Magazine editor Dennis di Cicco talks with Tom Field of Field Tested Systems about the growing number of amateur astronomers and educators doing backyard spectroscopy with simple equipment.
“Most teachers are astonished at how easy it is,” he says. Field also demonstrates his RSpec program, which transforms the image of a spectrum (including real-time video images) into a calibrated graph showing spectral features.
The page below shows some examples of the kinds of projects that can be done with a small telescope, DSLR, and a low-resolution diffraction grating, like our Star Analyser 100. With one or two clicks in our RSpec software, you can convert a standard FITS, jpg, RAW, or video image to scientific data like that below. It’s easier than ever to unleash your “inner scientist!”
If you have questions about these projects use our contact form at this link.
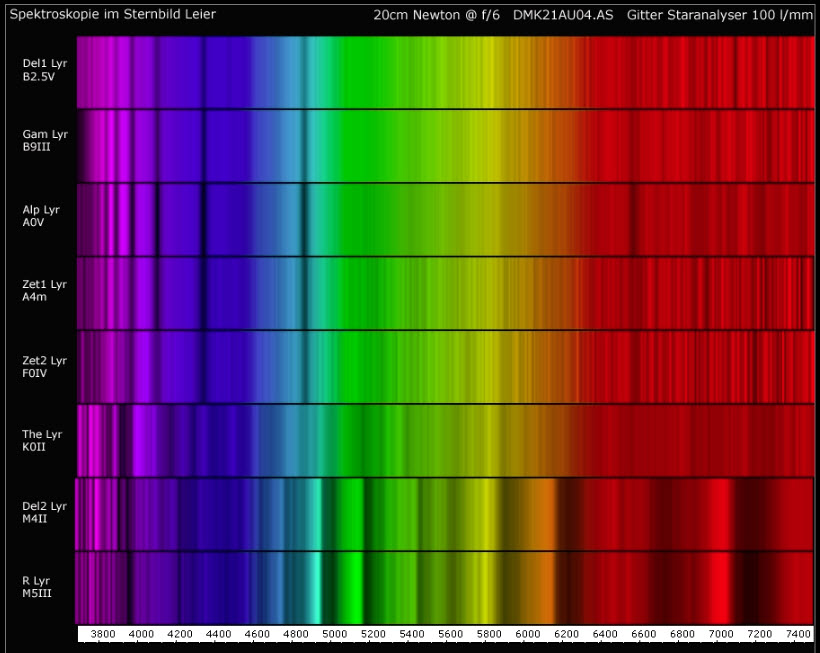
Characterizing Star Types: You can use a 6″ telescope to capture a collection of OBAFGKM spectra. When you compare them to one another, you will be able to discern differences in the absorption lines as shown below. You can also determine the star’s temperature and type by comparing their spectra to those in the RSpec Reference Library. This would make an excellent science project.
Below is a sample of some the excellent work done by Torsten Hansen, using a Star Analyser grating, an 8″ SCT, and an astronomical video camera. From top to bottom, the spectra are in temperature order. Notice for example, that the cooler stars near the bottom have some broad absorption bands in the red end of the spectrum. That’s the absorption from complex molecules that survive because the temperatures are so “low.”
Also notice, for example, that the Hydrogen Balmer (beta) absorption line at 4861 Angstroms is the strongest for the Type A star. This particular Hydrogen transition isn’t as prevalent in the hotter or cooler stars. See? There’s lots to learn here:
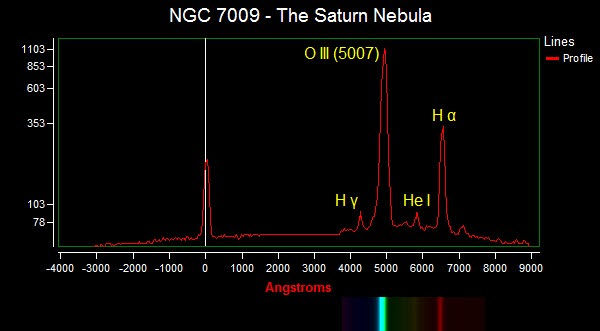
Detect the Emission lines on an Emission Nebula: An emission nebula is surrounded by a gas shell that is excited (like a fluorescent light). Below is a spectrum of the Saturn Nebula clearing showing its emission lines. The Orion Nebula (M42) would have a similar appearance.
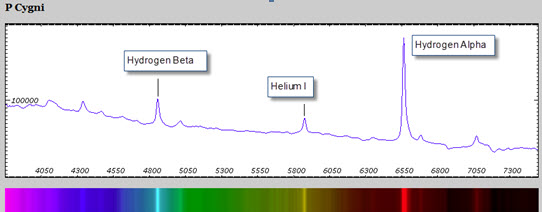
Detect the Spectrum of a Super-giant: The super-giant P-Cyngi shows distinct emission lines in the image below. Notice how they differ from the Saturn Nebula above. (François Teyssier)
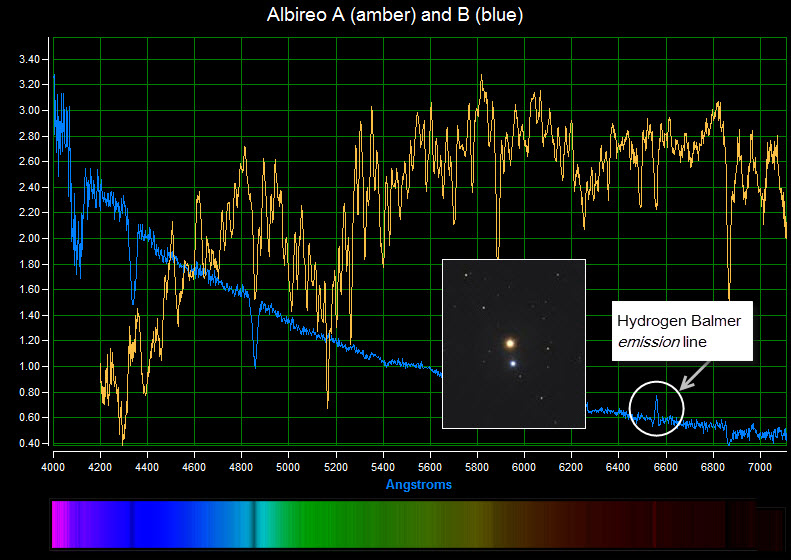
Study Star temperature and structure: The Albireo double (see inset) is, of course, the beautiful blue-gold showpiece that many of us are familiar with. The image below shows the spectra of its two main stars. You can easily see the energy on hotter Albireo B is concentrated in the blue end of the spectrum. And the energy of the amber star is towards the cooler red end, peaking in the amber/yellow region as expected. Notice the emission line (circled) at 6562? That’s from a glowing disk of gas around surrounding Albireo, which is a “Be” star. Wow! (Credit: Ken Whight)
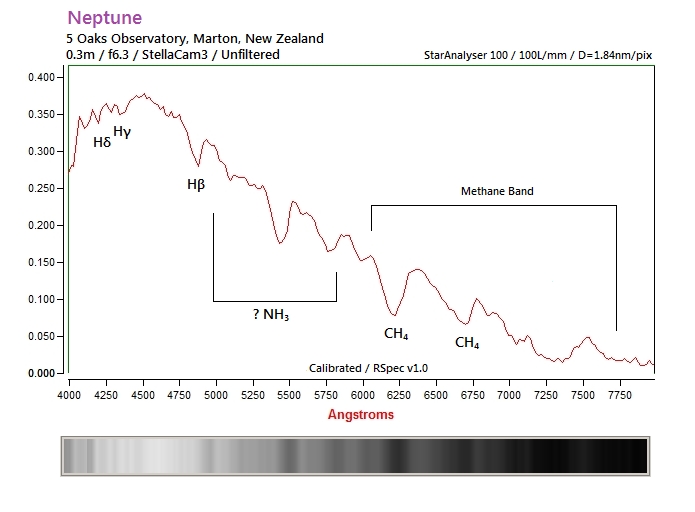
Detect the Methane bands in Neptune or Uranus: The image below by Paul Tervit shows the absorption by Neptune’s atmosphere. Paul used a 12″ telescope, but you can do this even with an 8″ scope, an astronomical video camera and our Star Analyser diffraction grating.
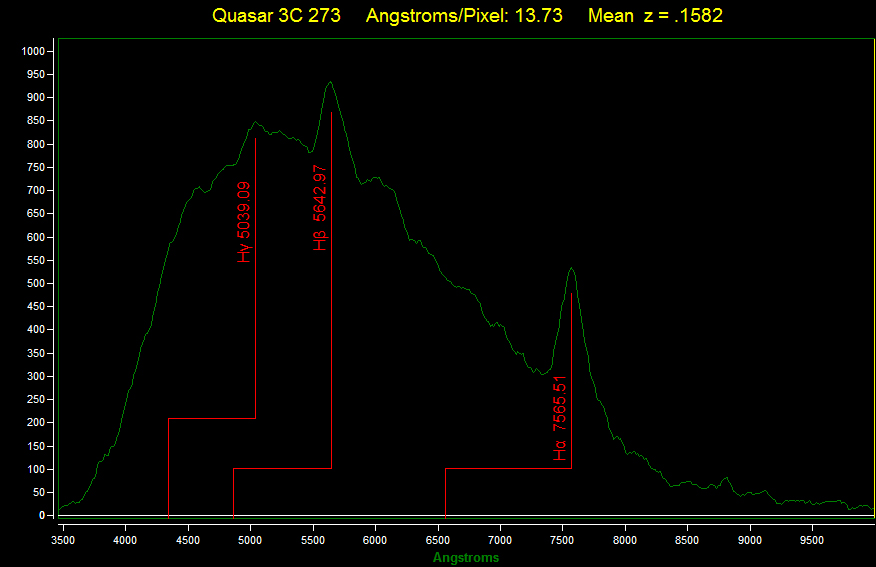
Detect the Red Shift of a Quasar that is 2 billion light-years away. William Wiethoff’s spectra (below) of QSO 3C 273 shows the redshift due to cosmological expansion. Wiethoff used a C14, Meade DSI Pro II CCD, and 20 x 15 seconds. Many amateurs capture this spectrum on 8″ telescopes with less than 15 minutes total integration time.
To read a transcript of a wonderful interview with Maarten Schmidt, the discoverer of this object, see link. Search for the text “December 1962″ for the relevant section. Want to study the redshift of galaxies.. with a small telescope or webcam? See link.
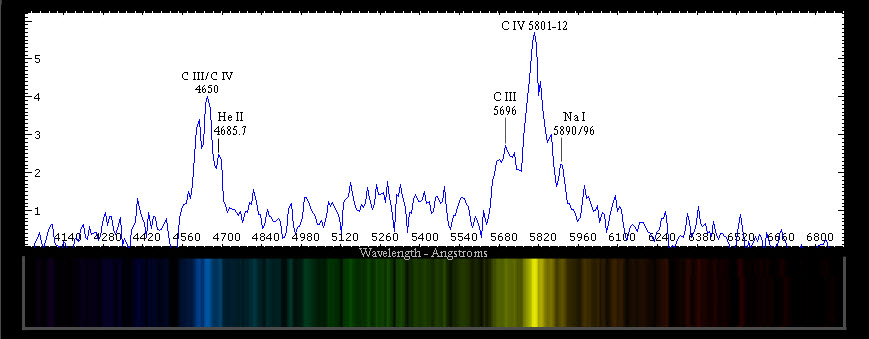
Wolf-Rayet Stars: The spectrum below is a fascinating view of a Wolf-Rayet star by Janet Simpson using just a Canon 350D DSLR and 85 mm lens, 30-second exposure with AstroTrac mount. She used the Star Analyser 100 for a grating. (For mounting hints, see this link.)
Wolf–Rayet stars are a normal stage in the evolution of very massive stars, which continually eject gas into space, producing an expanding envelope of nebulous gas. Notice the wide Carbon emission bands! Their width is attributed to the Doppler effect because the gas surrounding these stars is moving with velocities of 300–2400 km/s along the line of sight.
Here’s what Wikipedia has to say about these stars: “The characteristic emission lines are formed in the extended and dense high-velocity wind region enveloping the very hot stellar photosphere. This produces a flood of UV radiation that causes fluorescence in the line-forming wind region. This ejection process uncovers in succession, first the nitrogen-rich products of CNO cycle burning of hydrogen (WN stars), and later the carbon-rich layer due to He burning (WC & WO stars). Most of these stars are believed finally to progress to become supernovae of Type Ib or Type Ic.” (Credit: Wikipedia link)
Yes, it doesn’t take a ton of gear, skill, and dark skies to capture fascinating spectra like this one! It’s images like this that we find so enormously exciting.
Solar Spectroscopy: If you work with the sun, you can have fun doing astronomical spectroscopy and still get a good night’s sleep! Use a ball bearing or a sewing needle with a dark backdrop to get a spectrum of the sun. Be careful of your eyes. Never look directly at the sun or its reflection.
Here’s a creative and inexpensive apparatus that you can easily build to capture spectra of the sun. (For details, see his site: link.)
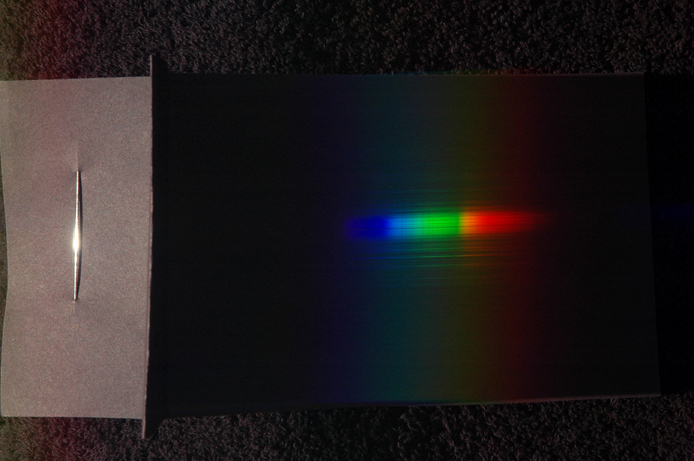
The above spectrum, when processed in RSpec, clearly shows the sun’s Fraunhofer lines:
RR Lyr Animation: This wonderful animation is just one evening‘s worth of images. Done by Umberto Sollecchia in Italy with just a 110mm refractor and our Star Analyser grating. Watch how the temperature of the star changes and how the Hydrogen beta line (at 4861) and others come and go! This amazing and exciting animation by Mr. Sollecchia shows the exciting kinds of observations that can be made by amateurs with small telescopes.
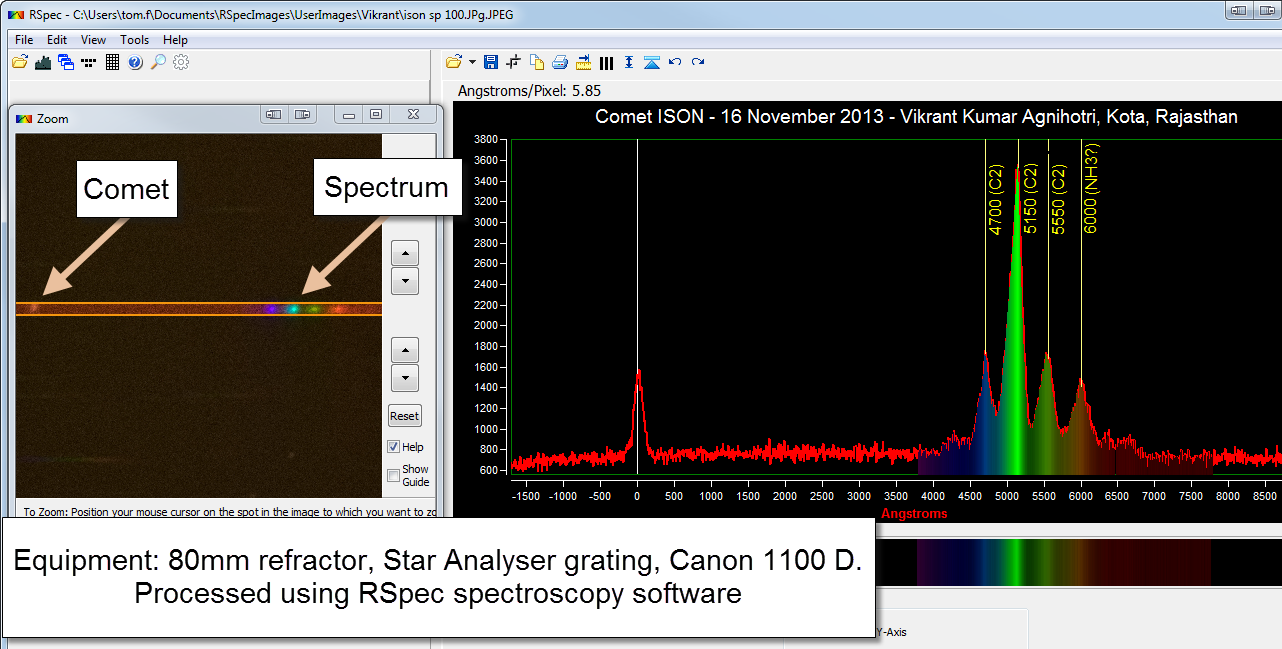
Comet ISON
Below: This image shows how easy it is for amateurs to study astronomical spectra. Vikrant Kumar Agnihotri in India captured this wonderful spectrum of ISON using a just an 80 mm refractor, simple Star Analyser grating, and a DSLR. It clearly shows the green glow from glowing Carbon (the so-called “Swan bands” – Wikipedia link) This image was captured from a rooftop in Rajasthan, and then processed in the RSpec software:
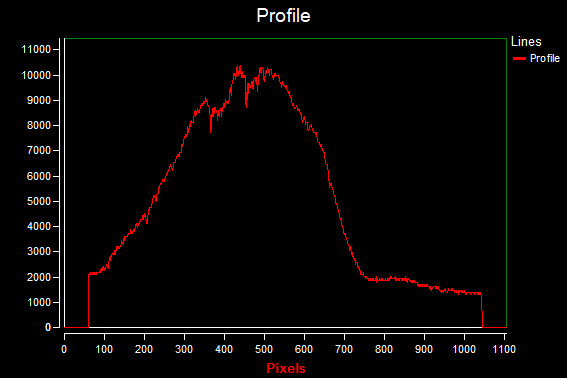
Supernova: Below is a wonderful spectrum of a supernova imaged by David Strange in the UK. The deep absorption marked as Silicon II is an indicator that this is a Type Ia supernova. At the time he took this image and created the profile, David had been using RSpec for just over a week.
What continually amazes people is how little integration time is needed to capture spectra. This spectrum was captured on a 9″ SCT, with only 30 twenty-five second images! We’re not talking about hours of integration time here, nor large aperture. Dark sky sites aren’t required either – spectroscopy is considerably less affected by urban light pollution than visual imaging.
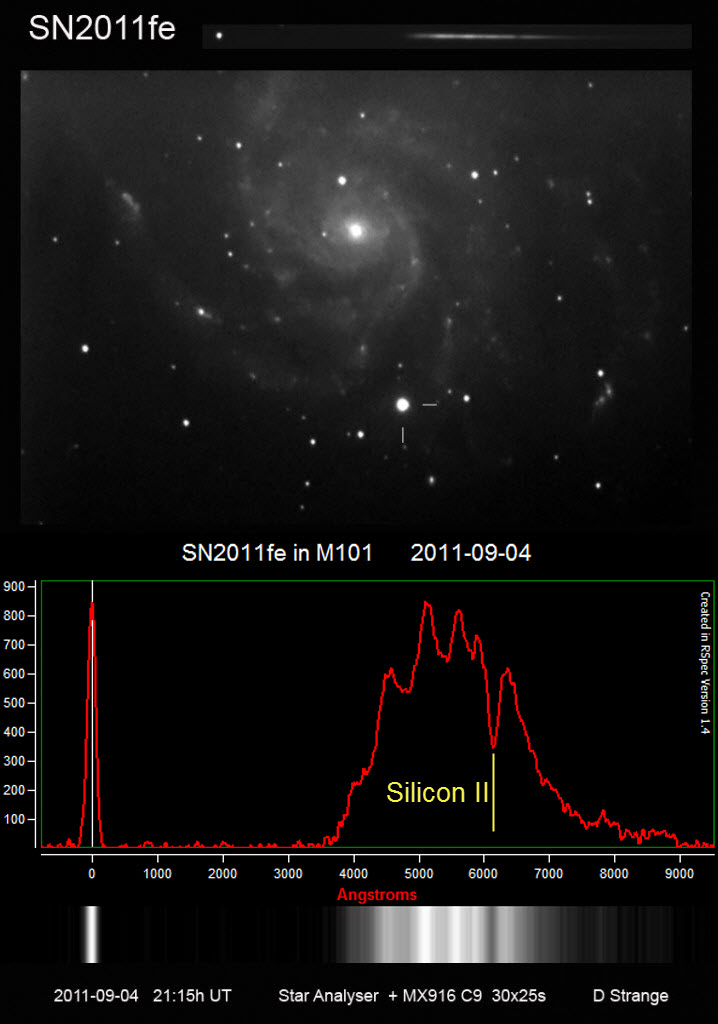
To download the original FITS image (courtesy of David Strange), right-click this link. Here’s a video that discusses calibrating this image: link.
Just a final comment on the above spectrum and calculation: this is jaw-droppingly exciting stuff. Imagine a backyard telescope measuring the Doppler shift of a supernova!
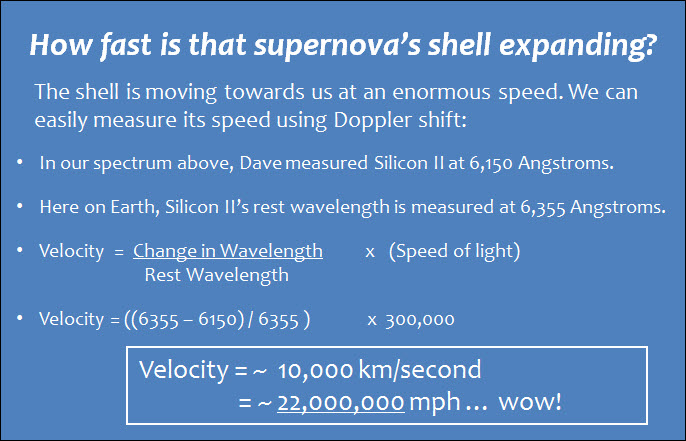
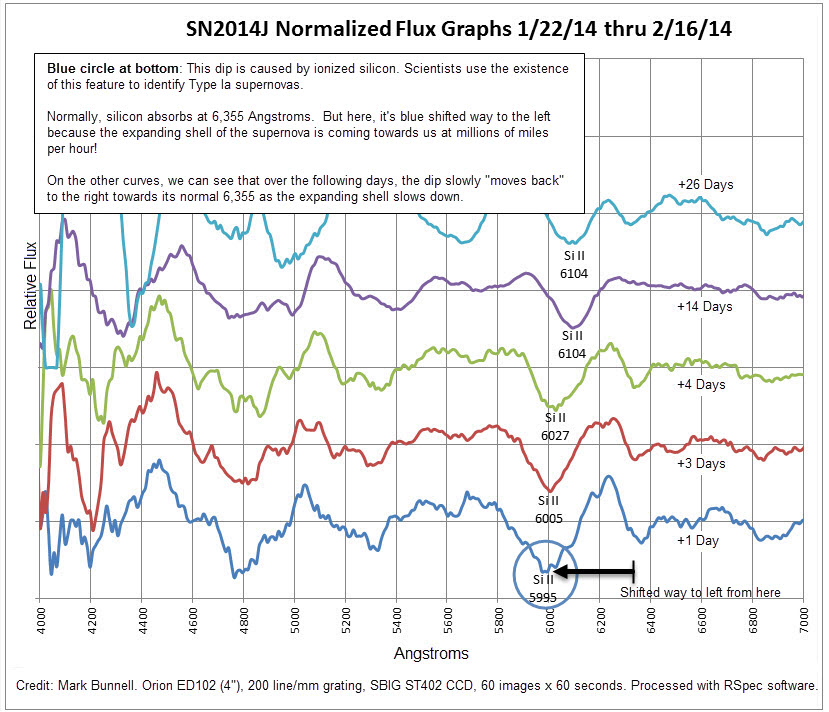
Measure the velocity of a supernova’s expanding shell
Below is a series of spectra taken of a recent supernova during the days and weeks after the event. These were taken with just a 4″ refractor!
Here’s the full description as it appeared in Sky & Telescope Magazine: link.
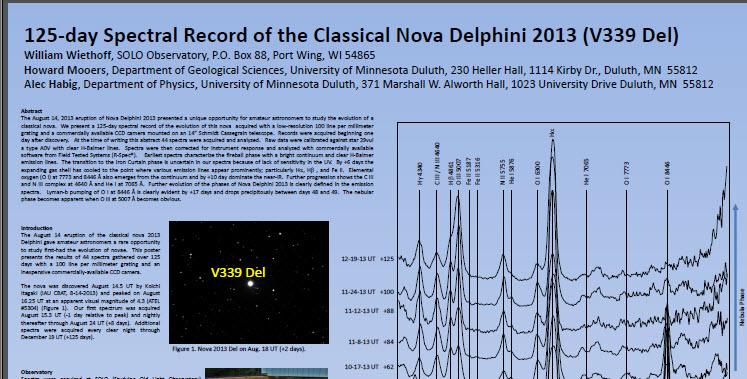
Studying Nova Evolution: Below is a poster that was presented at the 2014 American Astronomical Society meeting. Using a Star Analyser grating and RSpec, a team at the University of Minnesota captured 44 spectra of Nova Delphini 2013 over a period of four months. Major phases of the nova evolution can readily be identified. Click on this link to download the complete poster.
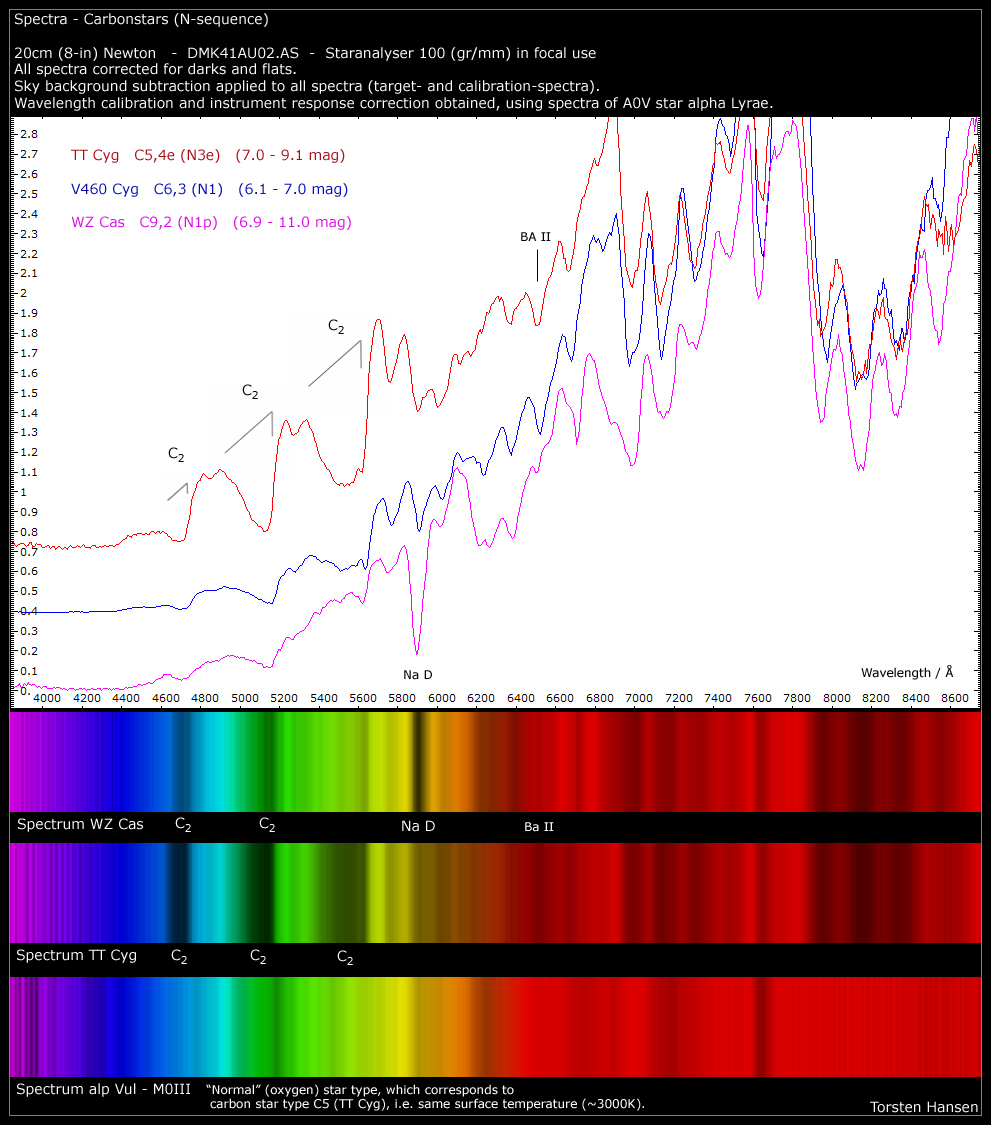
Carbon Stars: Below are some wonderful image spectra showing the C2 Swan bands on several Carbon stars. Notice how much stronger the signal is in the right-hand, red end of the spectrum. Read more about Carbon stars at this Wikipedia link. Credit: Torsten Hansen with just a 20 cm (8″) telescope, a Star Analyser grating, and a video camera from The Imaging Source.
Limb Darkening and Sunspot measurement
Robert Gill, Adjunct Professor in Physics, California State University, San Marcos uses RSpec in a novel way to teach solar limb darkening with a standard white light image of the sun. The video below also shows how sunspots can be measured using the RSpec software by grabbing an image off the web and dropping it into the software.